
Improving Memory Profiler Visualisations for OCaml

Principal Software Engineer

Communications Officer
Each year, Tarides has the pleasure of hosting several interns who work across different areas within the company. This year, we welcomed Kashish, who joined us to work on enhancing the visualisations for OCaml's memory profiling (you can check out our blog post about the return of Statmemprof for some more context). This post will explore Kashish's project and the steps we took to improve the visualisations available with OCaml's memory profiling tools.
Background: Improving the OCaml 5 Memory Profiler
First, a little background on the area. In OCaml, we have support for statistical memory profiling built into the runtime, called statmemprof. The basic idea is the OCaml runtime provides an interface for registering callbacks to be called when interesting Garbage Collection events occur, such that we can track memory allocation activity for some statistical sample of allocations in an OCaml program. PR #12923 has more technical details of the implementation.
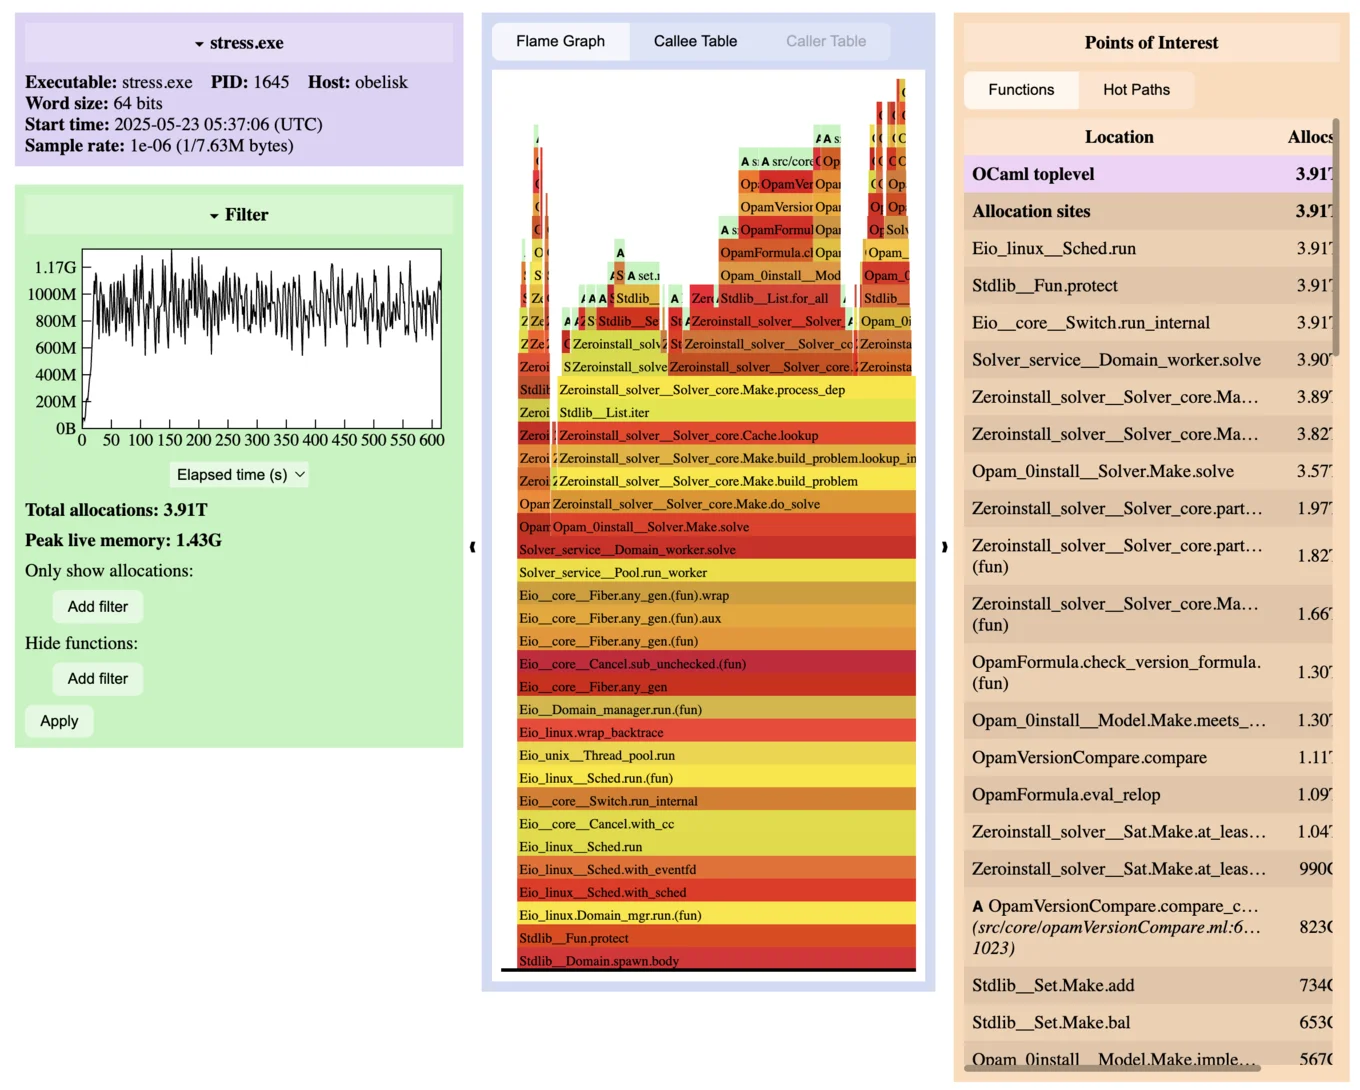
Built on top of this is memtrace, a library that uses the statmemprof interface to produce trace files formatted in the Common Trace Format (CTF). Memtrace has a detailed technical description of how it works. Finally, there is a web app, memtrace_viewer, that displays information about memory allocations using a 'FlameGraph' format to visualise the allocations. Below is a sample of what such a trace might look like.
For Kashish's internship we thought about how to support other kinds of visualisations for memory profiling data. For example, Go uses a directed graph visualisation in pprof that would be a good alternative to FlameGraphs. FlameGraphs are excellent for visualising data. However, they lack a useful property called join points, which are points where stack traces start differently and then reach the same important function. Using a graph representation highlights these points in a way that FlameGraphs cannot.
File Formats
A picture is worth a thousand words, and this is never more appropriate than when trying to understand a bunch of numbers collected from a complex system like a garbage collector (GC). We had two realisations in approaching this problem: one, that we could reuse the work done by others in visualising it, and second, that there are common tracing formats already used by other languages that we could reuse to unlock more visualisation options. For example, Memtrace used a CTF file format that looked like it could be converted to the protocol buffers (protobuf) based format used by pprof.
The first step towards converting formats was to understand the protobuf-based format. Looking at both the README.md and the profile.proto file gave an initial idea of the data types we needed. The pprof format is divided into three main parts: a Profile with general information, Samples recording values encountered in the execution of some program, and Locations identifying places within a program where samples are generated. Overall, the format is quite flexible and covers things like time profiling as well as memory profiling, which we're interested in.
Kashish looked at the pprof files generated from Go and Rust when doing memory profiling to see how they formatted their Samples. With this information, she started writing a tool to convert CTF traces into pprof traces. Starting with the profile.proto, she used pbrt and ocaml-protoc to generate the code for reading and writing the protobuf format; she then worked through the details of converting between the two formats. The end result is a cli tool for converting CTF files.
These files can be visualised using Go lang's pprof tool by running pprof -http localhost:8080 <proto_file>. For example:
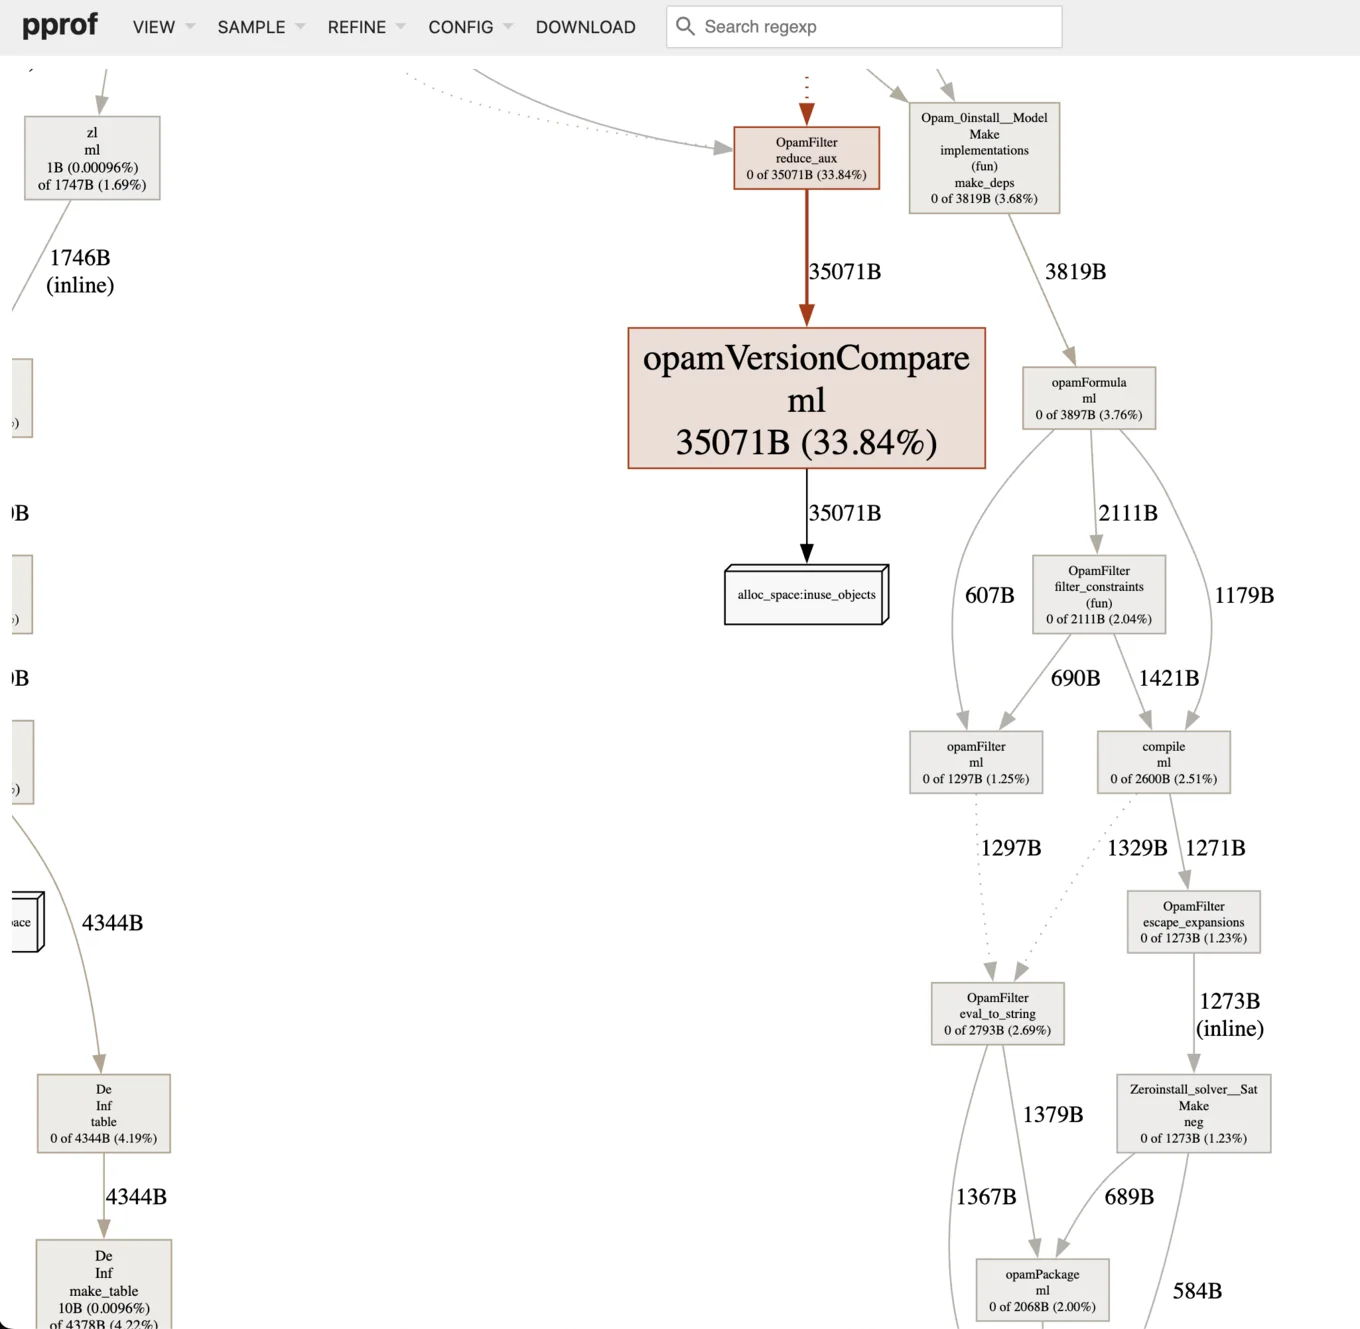
The picture is zoomed in on the opamVersionCompare function, which represents 33% of the allocations in this solver-service program.
From the top left menu, you can choose Sample to view the graph by the ‘number of samples’, i.e., the number of times a particular stack trace occurs in our profile or ‘alloc size’, i.e., the amount of memory allocated by each stack frame.
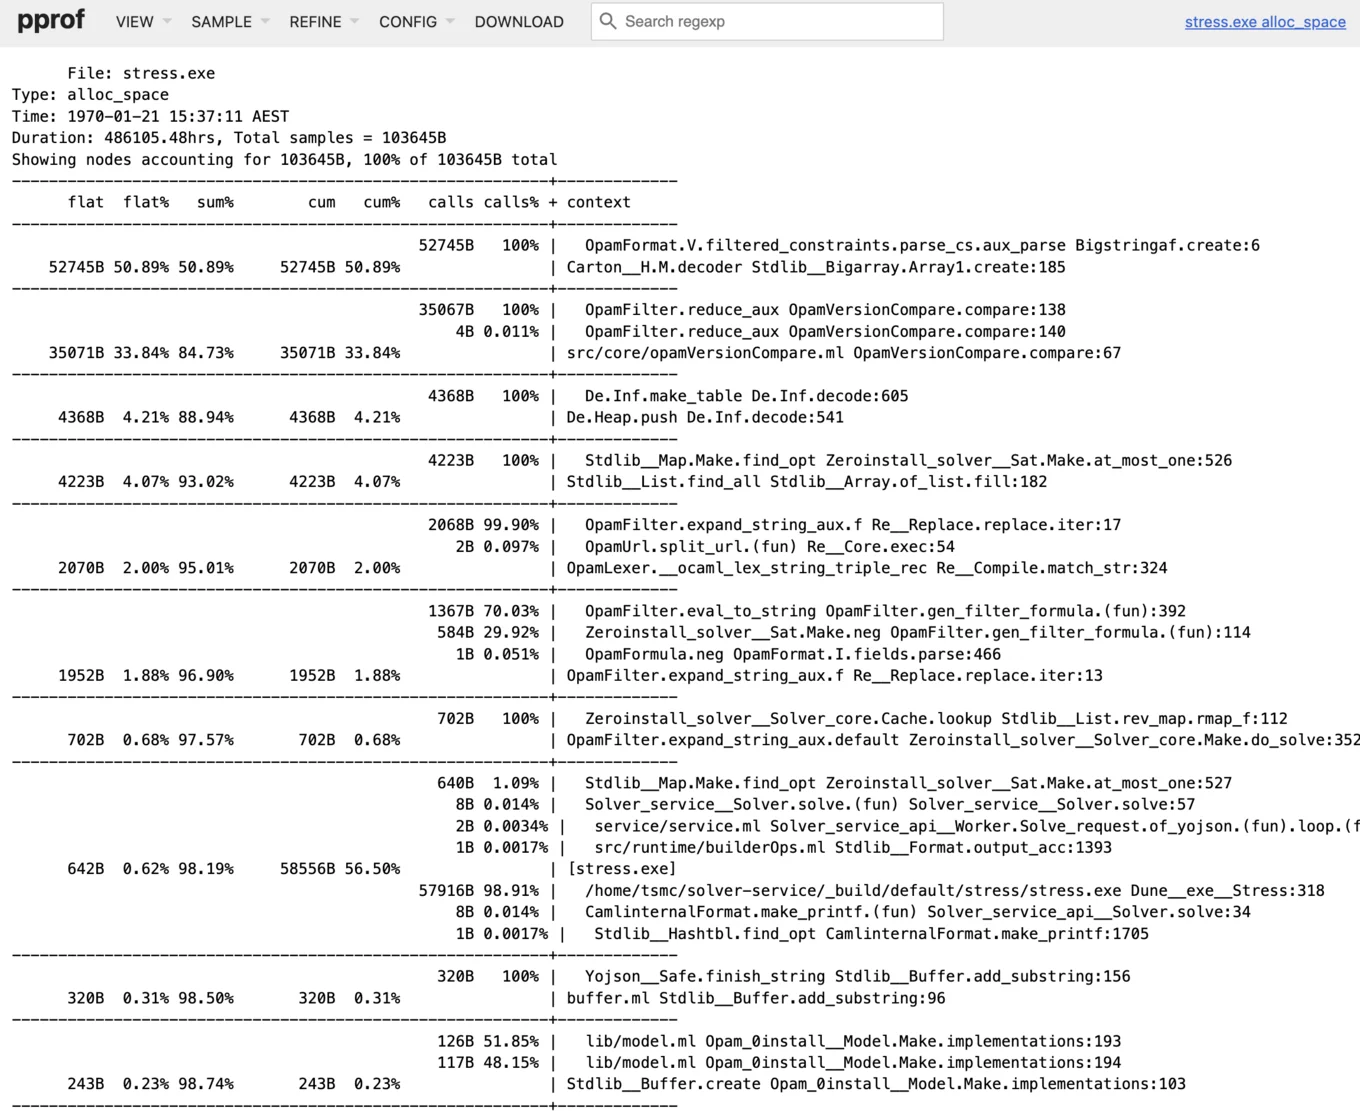
You can also use Peek to see a breakdown of allocations sorted by space allocated or objects allocated. In GC parlance, an object is a dynamically allocated piece of memory that contains an OCaml value. This visualisation can highlight the top allocating locations in an OCaml program. This first image shows the top allocating functions based on the memory size of their allocations and highlights code in OpamFormat parsing that is worth investigating.
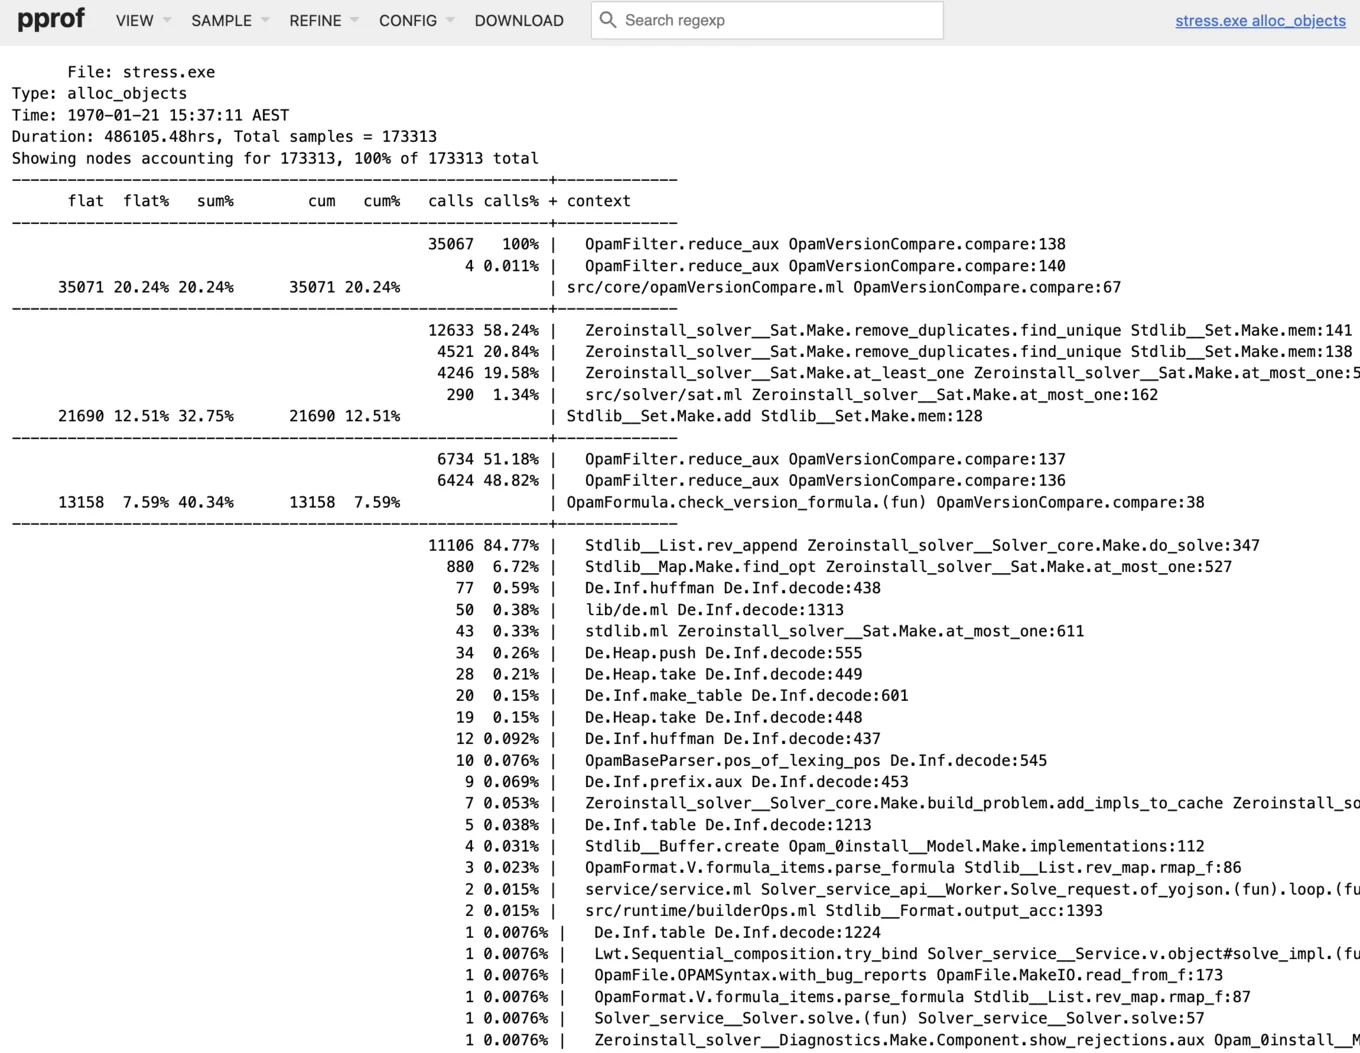
This second image shows the top object allocating functions unrelated to the amount of memory being allocated, which can highlight places that allocate many small pieces of memory and often go unnoticed. Note this again highlights the opamVersionCompare function.
A Library for Mappings: Blind Alleys
The pprof format contains a field called Mappings, which uses information about the executable binary and the virtual addresses of functions or Locations in our stack traces. We thought we needed to get the virtual memory address for symbols to include as part of the stack traces in the profile. This would allow users to map addresses back to locations in the source code via the addresses in the executable.
However, these virtual addresses are not known until runtime, so we needed to get the virtual memory maps for the running process. On Linux, this information was available in the proc filesystem as /proc/<pid>/maps and simply required parsing out the information into a usable type. Then, we mapped the virtual addresses to a segment and back to locations in the original binary.
On MacOS, things are much more exciting and tricky. On the surface, macOS is a Unix operating system based on a FreeBSD userspace; however, under this facade is another operating system called Mach, which is actually responsible for many aspects of the system, including how virtual memory maps for a process are represented. So, what we needed to do was write some low-level OCaml using c-types to call the right C functions to retrieve the information we needed. How that works deserves its own blog post, but you can read the code at tmcgilchrist/mach.
Later on, we realised that pprof traces could work in two ways; with memory addresses for compiled languages like C++ or Go or with symbolised locations for interpreted or JIT'd languages like Java or Python. The documentation calls these Unsymbolized profiles and Symbolized profiles respectively. OCaml will produce Symbolized profiles by default as Statmemprof supplies the location information for symbols. In future, Unsymbolized profiles could be supported, and even information like demangled names and source file locations could be included.
Writing pprof Directly
With the conversion code written and confident in our understanding of the file format, the next task was to write protobuf files directly from memtrace using the callback API provided by Gc.Memprof.start and creating a Gc.Memprof.tracker record. The resulting code was similar to the conversion code; however, there are some interesting points of difference for protobuf traces.
Protobuf traces tend to be larger than the equivalent CTF traces. This is because memtrace optimises the data written to a trace. The most important optimisation is the way it stores callstacks, as they are the single biggest piece of information stored. Consecutive backtraces usually only differ by the last few entries, so instead of storing the entire callstack each time, they store a “common prefix”, i.e., the number of entries that are the same as the callstack of the previous sample. Then, the reader can obtain the entire callstack by combining the “common prefix” entries with the new, unique entries.
With our restriction to use pprof for visualisations, we needed to use the pprof format as defined, and the pprof format does not support common prefixes. Meaning we could not implement common prefixes in our writer. In the future, it could be possible to write our own protobuf decoder that supports this feature.
To produce smaller trace files, pprof compresses its protobuf files using gzip, which significantly reduces their file size, making them much smaller than CTF files. To similarly reduce memory overhead in the protobuf writer, one option is to integrate an OCaml compression library such as camlzip to compress the output on the fly as data is written. Naturally, this introduces a trade-off: lower memory usage at the cost of increased CPU time. For example, when profiling a sample program, the CTF file is 25Mb versus 421Mb for protobuf, which reduces to 8.3Mb when gzipped.
The Go and OCaml Garbage Collectors differ in important ways that impact the information collected in trace files. Since the premise of this work is reusing the Go tooling and visualisations, it is useful to understand what kind of Garbage Collector Go uses.
Go uses a Tracing Garbage Collector with the following properties:
- Hybrid stop-the-world/concurrent collector
- Stop-the-world limited by a deadline (10 ms)
- Concurrent collector running in parallel on CPU cores
- Tri-colour mark-and-sweep algorithm
- Non-generational
- Non-compacting
Of these the most important property is Go's GC isn't generational, while OCaml's is a generational GC. Memtrace tracks deallocation and promotion events between the generations. Currently, we're not tracking these events as pprof was built for Go programs and doesn't handle this information. The next obvious step would be writing out these events and building the visualisations to handle them.
Collateral Fixes
In the process of writing tests for the conversion tool, Kashish also discovered some failing tests in the OCaml 5 version of Memtrace caused by the way the Gc.Memprof API interacts with threads and the new domains introduced in OCaml 5. They were fixed in this PR and will be included in the OCaml 5.3 support PR.
Until Next Time
The goal of the internship was to improve visualisation options for memory profiling in OCaml by investigating different profiling file formats and then build tooling to generate (or convert) to these formats. Pprof is a protocol buffers-based format used by Go, Rust, and Java to capture profiling information. Kashish built tooling for converting CTF trace files to protobuf format and writing protobuf format directly from memtrace, both of which allow users to visualise memory profiles using a directed graph format originally used by pprof.
In future, it would be interesting for the OCaml community to build on this work by:
- Extending protobuf format to record all OCaml GC events.
- Updating memtrace viewer to consume pprof format directly.
- Producing Unsymbolized profiles from stripped binaries (i.e. without symbol information and just addresses). Reconstituting symbolised information afterwards, similar to C++ or Go.
- Supporting encoding and decoding common prefix stack traces.
- Adding different kinds of visualisations like treemaps, force directed graphs, or circle pack layout
We would welcome contributions in these areas. Get in touch if anything there looks interesting or useful.
You can connect with us on Bluesky, Mastodon, Threads, and LinkedIn or sign up for our mailing list to stay updated on our latest projects. We look forward to hearing from you!
Open-Source Development
Tarides champions open-source development. We create and maintain key features of the OCaml language in collaboration with the OCaml community. To learn more about how you can support our open-source work, discover our page on GitHub.
Explore Commercial Opportunities
We are always happy to discuss commercial opportunities around OCaml. We provide core services, including training, tailor-made tools, and secure solutions. Tarides can help your teams realise their vision
Stay Updated on OCaml and MirageOS!
Subscribe to our mailing list to receive the latest news from Tarides.
By signing up, you agree to receive emails from Tarides. You can unsubscribe at any time.