
Are Your Programs Doing What You Think They're Doing? Introducing Monitoring Tools for Multicore OCaml

Communications Officer
As programs grow in size and complexity, they become more challenging to optimise. When the cause of a particular performance issue can theoretically be attributed to multiple sources, developers need concrete data to drive their decision making and avoid time-consuming guesswork. As you can imagine, OCaml 5’s new multicore capabilities – whilst bringing significant performance improvements – can compound this problem even further.
In light of this, it’s easy to see how organisations that use large numbers of co-operating servers to run big systems can struggle to narrow down even the when and how of a performance drop. Fortunately for users of OCaml, the language comes with built-in features that allow them to monitor its runtime and get automatic reports.
OCaml 5 introduced multicore support and, alongside it, the ring-buffer-based monitoring system runtime_events. From then onwards, teams have been working on adding more features, including custom events, which allows developers to monitor user events, and Olly, a tool providing nicely formatted data helping users to visualise program behaviour. These features make performance in OCaml easier to troubleshoot, optimise, and monitor.
The Eventlog Legacy
Monitoring the OCaml runtime is not a new idea, and before the 5.0 release, the language supported it via a feature called Eventlog. As the name suggests, eventlog did indeed monitor the runtime logging events to a file. This method would eventually result in massive log files that used up a lot of disk space.
Due to eventlog’s design, it was unsuitable for long-running programs that needed to be monitored continuously for extended periods. Users had to set up their runtime in a special way to use it in the first place, and then it would still introduce a performance hit. As a result, there was a push to upgrade the feature and make it more widely applicable in conjunction with OCaml 5. Enter Eventring!
Ring Buffers and Runtime Events
Eventring was the previous name for what is now called runtime_events. In 2021, Tezos needed more monitoring tools for the OCaml runtime, and they originally funded Sadiq Jaffer’s (then as part of Opsian) efforts at introducing the eventring monitoring system. The ‘ring’ part hints at the ring-buffer-based system he used to replace eventlog.
A ring buffer is a data structure that consists of two pointers in a linear backing array, where the “tail pointer points to a location where new events can be written and the head pointer points to the oldest event in the buffer that can be read.” When there is no more space in the array (when the tail pointer reaches the head pointer), the head pointer is advanced, and the oldest events are overwritten. When either pointer reaches the end of the array, it wraps around to the beginning.
The ring buffer can continuously write and overwrite data from the runtime into the array, keeping the memory used constant. This system stays lightweight and low-impact rather than creating an ever-increasing log file. When enabled, the runtime_events architecture introduces less than 0.5% overhead so that users can monitor their runtime continuously without performance woes.
Runtime_events emits raw events, which are low-level pieces of data ready to be combined into meaningful reports by tools like Olly. There are three main types of events that runtime_events emits:
- Spans: These are events spanning a period of time, with a starting and an ending point. For example, a span beginning when a minor collection starts in the garbage collector (GC) and ending when it stops.
- Lifecycle Events: These occur at a moment in time. For example, a lifecycle event can be emitted when a domain terminates.
- Counters: These events include a measurement of quantity, such as the number of words promoted from the minor to the major heap during the last minor GC.
These events allow developers to monitor the OCaml runtime by enabling runtime_events and choosing what classes of events they want to receive. You can run OCaml as usual and leave the monitoring system in the background. When something of interest happens, such as a performance drop, you can retrieve the recently emitted events from the ring buffers and examine precisely what the runtime was doing.
With runtime_events, users gain an unprecedented understanding of what the runtime environment is doing at different points of interest. With runtime_events, end users can expect continuous performance data extraction with very low overhead.
As of OCaml 5.0, this feature was exclusive to GC and runtime events, meaning user events were left out. However, the OCaml 5.1 release would change this by introducing custom events.
Custom Events
The addition of runtime_events and its spans, counters, and lifecycle events inspired Lucas Pluvinage to add support for custom events. Custom events are generated by the user as opposed to by OCaml itself. Custom event support allows you to generate events from runtime_events to see what the GC and runtime were doing when your program was active and if other user events were triggered.
One example of how to use custom events comes from Lucas himself. He was trying to understand some performance issues he was experiencing in a multicore Eio program. He figured out – using runtime_events and olly – that the domains had difficulty synchronising in the major GC. One domain was waiting for 200 milliseconds(!) without him being able to figure out why. But, by adding custom events of the span types in eio, he could see that the time was spent in a system call not marked as a blocking section. Armed with this information, Lucas could finally address the underlying issue.
The motivation behind this feature is to give more experienced users tools that give them greater freedom and specificity to monitor and optimise their workflows. For casual users, the three standard events (spans, counters, and lifecycle events) are great for getting a good overview of the runtime. Still, custom events allow for a more granular approach.
Now, adding custom events for phases of your program does help you understand how they affect the runtime and vice-versa, but that is not the only way to use them. If you wanted to, you could ignore events from the runtime entirely and only use custom events to understand what your own programs are doing. For example, how long have they been waiting for data from external services? How big are their internal queues? What kind of latency is there for each request they serve?
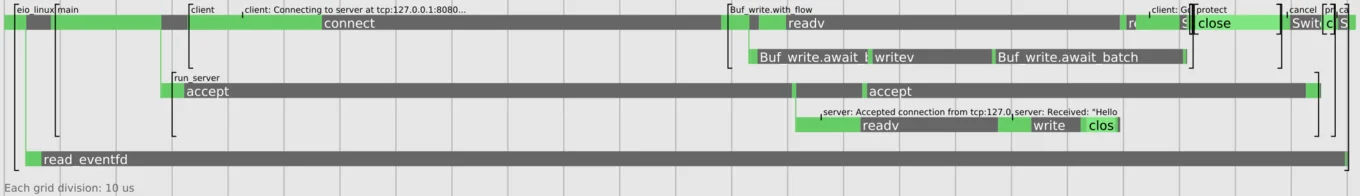
This new feature adds another dimension to the event monitoring systems for OCaml, allowing for more customised monitoring. Users can discover how aspects of their code are affecting the runtime and use the reports to optimise their programs. In turn, this benefits the rest of the ecosystem as programs become faster and more efficient. For example, the observability tool eio-trace (more about that at another time) uses custom events to give the user a graphical representation of what is happening with their programs – shown here tracing the Eio tutorial's networking example:
Please note that whilst custom events were introduced in OCaml 5.1, the update to the OCaml manual reflecting this change will be introduced in OCaml 5.2.
Olly & Observability
To make these features as accessible as possible for the end user, the team working on runtime_events also introduced observability tooling. The observability tool for OCaml is called Olly, and it helps users visualise the data collected from runtime_events.
But more about that another time! Look out for future posts about Olly and how to use it to understand what your programs are doing. It’s a fantastic tool that can change how you interact with your code, removing the guesswork and giving you great insight into any performance problems you encounter.
Stay in Touch!
If you’re curious to explore these features and how they can benefit your workflow, you’re in luck! We would be happy to talk to you about how OCaml can benefit you and your projects and how monitoring tools can help you get the most out of your software.
Stay in touch with us on Bluesky and on LinkedIN, where we regularly post updates about what we are working on.
Acknowledgements
Thank you to Sadiq Jaffer and Nick Barnes for their help with this article.
Open-Source Development
Tarides champions open-source development. We create and maintain key features of the OCaml language in collaboration with the OCaml community. To learn more about how you can support our open-source work, discover our page on GitHub.
Explore Commercial Opportunities
We are always happy to discuss commercial opportunities around OCaml. We provide core services, including training, tailor-made tools, and secure solutions. Tarides can help your teams realise their vision
Stay Updated on OCaml and MirageOS!
Subscribe to our mailing list to receive the latest news from Tarides.
By signing up, you agree to receive emails from Tarides. You can unsubscribe at any time.