
Introducing Olly: Providing Observability Tools for OCaml 5

Communications Officer
It might be tempting to think that we can write code that works perfectly the first time around, but in reality optimisation and troubleshooting forms a big part of programming. However, there are more and less productive (and frustrating!) ways of problem solving. Having the right tools to guide you, ones that show you where to look and what is going wrong, can make a huge difference.
We recently introduced you to the monitoring system runtime_events, which allows users to monitor their runtime for, among other things, how programs are affecting performance. Alongside runtime_events, sits the observability tool olly, which provides users with a number of helpful formatting options for their runtime tracing data.
This is all part of how we’re making developing in OCaml easier by bringing new features and tools to the community. Olly is just one such tool, and it makes the monitoring system for OCaml significantly more accessible. With Olly, you don’t have to be an expert or spend time combing through the data that runtime_events extracts for you. Rather, Olly can generate the information you need in a way that makes it easy to understand, store, and query.
What is Olly and How Does it Work?
Olly, as an observability tool for OCaml 5, has the ability to extract runtime tracing data from runtime_events. This data can then be visualised with a variety of graphical options available.
How does Olly do this? Olly uses the Runtime API to provide you with monitoring metric information and associated data. The tool comes with several subcommands, each with its own function.
The command olly trace can generate runtime traces for programs compiled in OCaml 5 using its trace subcommand. The tracing data is generated in one of two formats, the Fuschia trace format or the Chrome tracing format with the former being the default. Both formats can be viewed in Perfetto, but the Chrome format trace can also be viewed in chrome://tracing for Chromium-based browsers. Another example of a subcommand is olly gc-stats, which can report the running time of the garbage collector (GC) and the GC tail latency of an OCaml executable.
The motivation behind introducing an observability tool like Olly is to make data extracted using runtime_events more useful, since few developers will want to use the event tracing system directly. Olly makes it easy for users to troubleshoot their own programs, but it also makes it easy for a developer to diagnose why someone else’s program is slow. A client can send their runtime_events data, a feature that comes built in with every OCaml 5 switch, to a developer who can then use Olly to find the problem and suggest a solution. This makes working in OCaml is easier as optimisation and problem solving becomes more efficient and streamlined.
It doesn’t end there! One of our future goals for Olly is that it should be able to provide automatic reports and diagnosis of some problems. Look out for that exciting update in the future!
Recent Update: Modularising Olly
One of the latest updates to Olly is its modularisation by Eutro, splitting the bin/olly.ml file into smaller discrete libraries including olly_common, olly_trace, and olly_gc_stats. By splitting up the large file, the user can exercise some control over which dependencies they want their library to have. They can create a minimal build with minimal dependencies, or stick with a fuller build relying on all the dependencies. For example, to build olly_bare on the trunk you now only require two dependencies: Dune and cmdliner. Both can be installed without using Opam. Since some developers will prefer this set up, it’s good to support a variety of configurations.
It also potentially makes it easier to maintain, since the smaller files have well-defined purposes and provide a clearer overview than just having one large file covering a multitude of functions. If something breaks, this segmentation can make it easier for a maintainer to triage and amend the problem. The same modularisation may also help newcomers get an overview of all the different components of the library. Sadiq Jaffer merged Eutro’s PR #43 into Tarides: main and it will form part of a future Olly release pending further testing.
How to Use Olly: an Example
Let's wrap up by looking at an example of when you might use Olly. When we want to visualise the performance of the OCaml runtime alongside any custom events we may have, the first step is to generate a trace. To generate a trace, we run the command olly trace tracefile.trace in combination with the name of the program we want to enable tracing for. If we wanted to generate a trace for the solver-service, the command would be olly trace tracefile.trace 'solver-service'.
For our example, we chose to generate the tracing data in the Fuschia trace format. Once we had the trace, we loaded it into Perfetto to get a helpful visual representation of what our code is doing and we ended up with the following image:
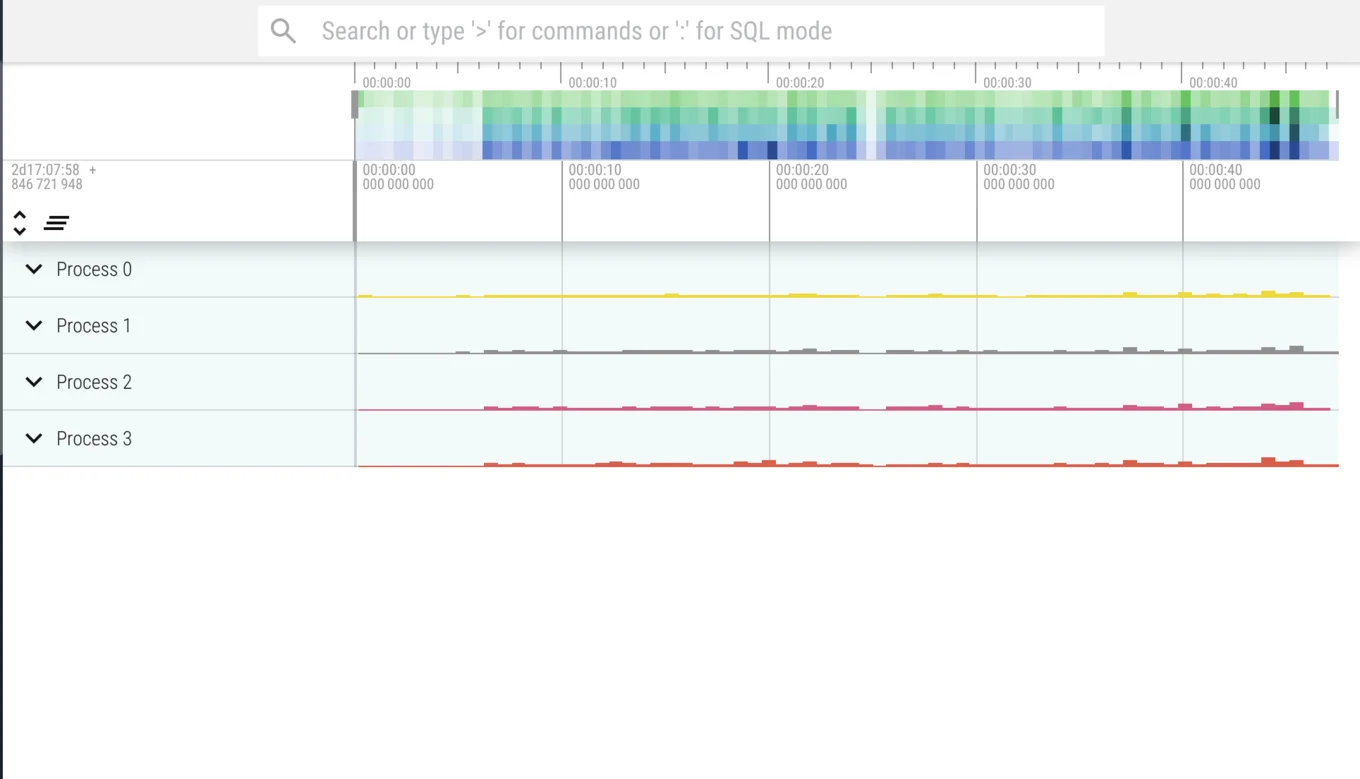
The UI in this image displays the processes down the side, each corresponding to a domain. Our program ended up using four cores, and therefore, the image shows four processes. Each process, in turn, shows the tracing for the OCaml runtime build plus the custom events generated by Eio. Let's zoom in on one process now:
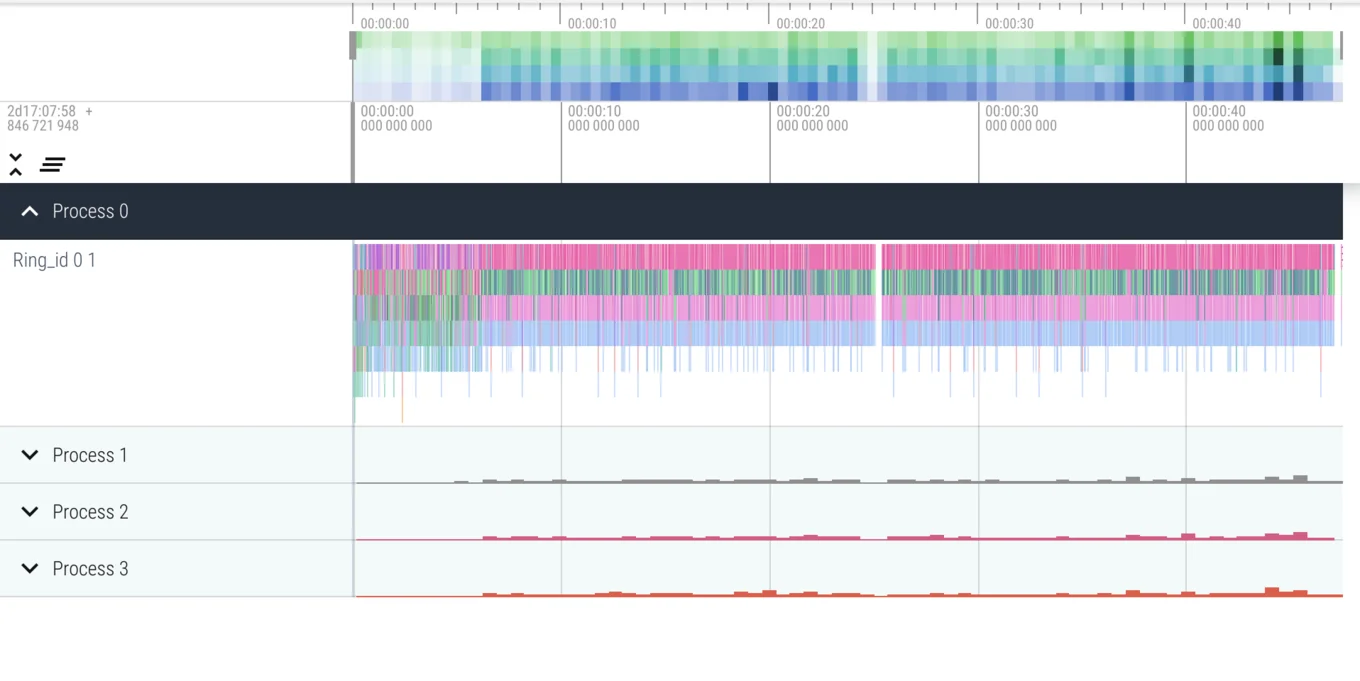
This expanded view shows both the Garbage Collector's (GC) activity and times when Eio is suspended.
Until Next Time!
We want to create tools that make the developer experience in OCaml easier and more intuitive. Olly makes it possible to visualise your code's performance, helping you understand when your programs are slowing down and why. If you have suggestions or improvements to share, you are welcome to participate in the Runtime Events Tools repo on GitHub.
We want to hear from you! Connect with us on social media by following us on Bluesky and LinkedIn. You can also join in with the rest of the community on the forum Discuss to share your thoughts on everything OCaml!
Open-Source Development
Tarides champions open-source development. We create and maintain key features of the OCaml language in collaboration with the OCaml community. To learn more about how you can support our open-source work, discover our page on GitHub.
Explore Commercial Opportunities
We are always happy to discuss commercial opportunities around OCaml. We provide core services, including training, tailor-made tools, and secure solutions. Tarides can help your teams realise their vision
Stay Updated on OCaml and MirageOS!
Subscribe to our mailing list to receive the latest news from Tarides.
By signing up, you agree to receive emails from Tarides. You can unsubscribe at any time.